


 By
By  January 02, 2024 at 03:37 PM


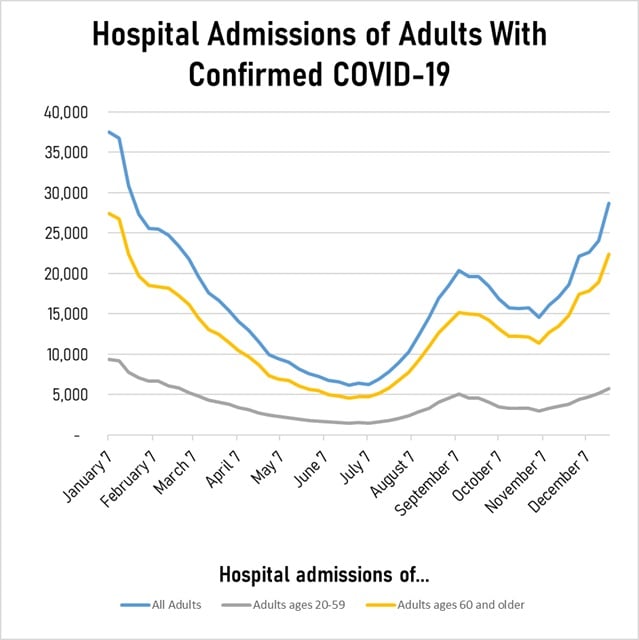
The current wave of COVID-19 cases continues to swell, pushing more working-age Americans into hospitals.
The number of people ages 20 through 59 who entered the hospital with confirmed cases of COVID-19 increased to 5,728 in the week ending Dec. 23, according to hospitalization data collected by the U.S. Department of Health and Human Services.
That was 12.1% higher than the number recorded in the week ending Dec. 16, and it was 285% higher than the number recorded in the week ending July 1, when the pandemic seemed to be ending.
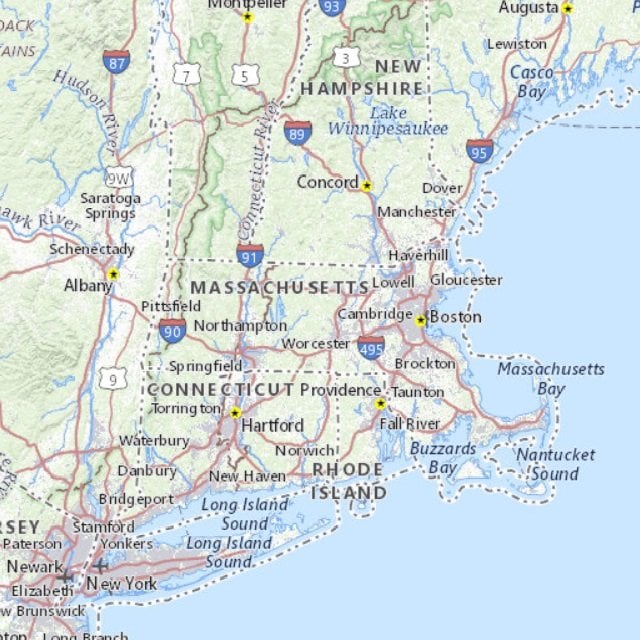
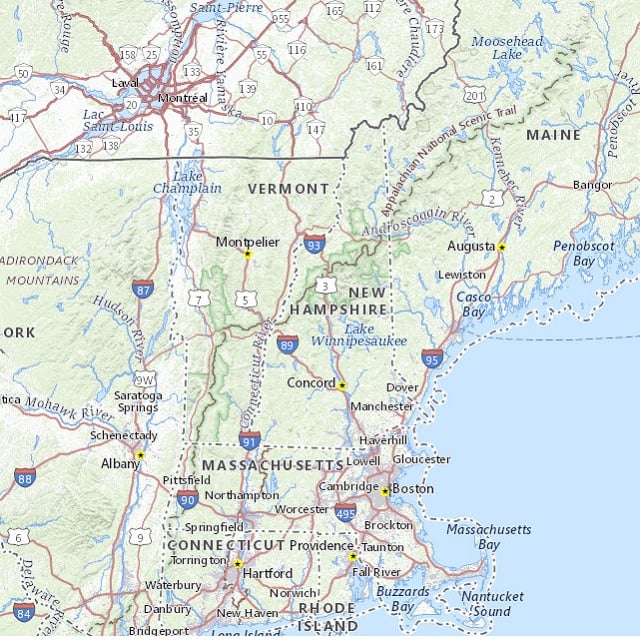
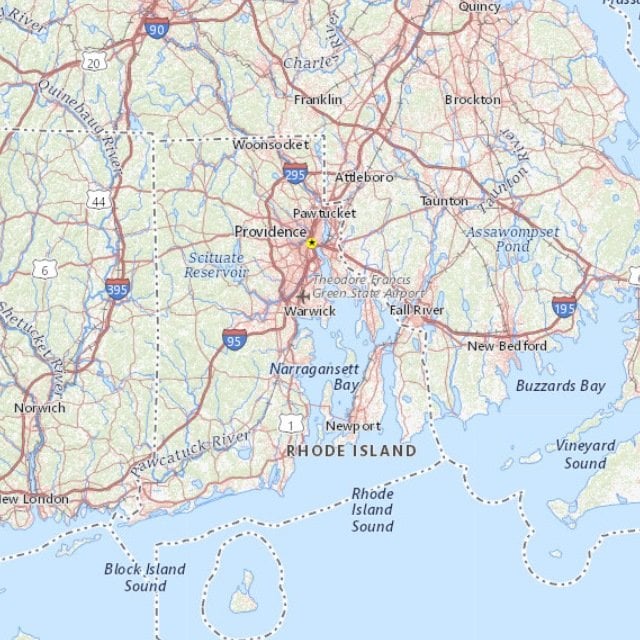
At the state level, working-age hospitalization count changes between the previous week and the latest week ranged from a decrease of 54%, in Wyoming, up to an increase of 100%, in one state in New England, with a median of about 13%.
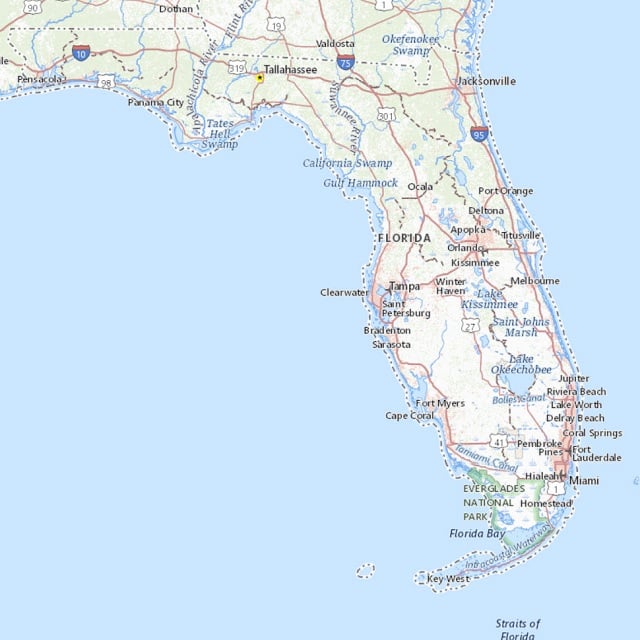
See the accompanying gallery for a look at the 12 hardest-hit states, where the one-week working-age COVID-19 hospitalization count increases were all over 36%, and a chart showing how hospitalization counts have changed since Jan. 1.
See the table below for data for all 50 states, the District of Columbia and Puerto Rico.
If we had included the District of Columbia and Puerto Rico in the gallery, they would have ranked at the top, because their week-over-week working-age COVID-19 hospitalization count increases were more than 100%.
What it means: COVID-19 is still here, along with flu, pneumonia and other infectious diseases that have traditionally thrown off financial professionals’ mortality and life expectancy projections.
Deaths: Age breakdown figures for deaths that are comparable to the hospitalization data are not yet available.
The hospitals that reported COVID-19 cases told HHS that 681 of their patients died of COVID-19 in the latest week.
That was 18% higher than in the previous week and 78% higher than in the week ending July 1, and it was the highest pandemic-related death count reported by the hospitals since they sent in data for the week ending April 1.
Many people who have COVID-19 recover without going to the hospital, but the number of COVID-19 patients dying each week now amounts to about 2% to 3% of the number of adults of all ages who enter the hospital with the condition each week.
Hospital admissions for adults with confirmed COVID-19 |
||||||||
|---|---|---|---|---|---|---|---|---|
| For the week ending… | ||||||||
| July 1 | Dec. 16 | Dec. 23 | Change between weeks ending Dec. 16 and Dec. 23 for… | |||||
| All adults | Ages 20-59 | All adults | Ages 20-59 | All adults | Ages 20-59 | All adults | Ages 20-59 | |
| ..Alabama.. | ..90.. | ..29.. | ..382.. | ..68.. | ..437.. | ..86.. | ..+14.4%.. | ..+26.5%.. |
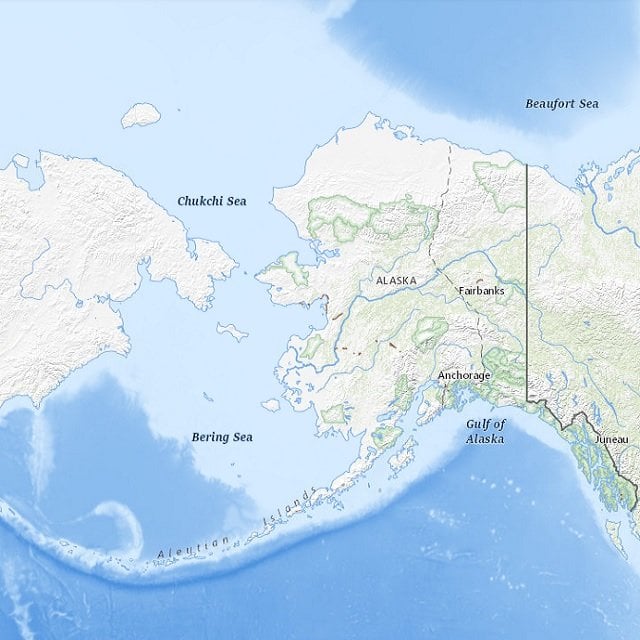
| ..Alaska.. | ..20.. | ..2.. | ..17.. | ..4.. | ..19.. | ..6.. | ..+11.8%.. | ..+50.0%.. |
| ..Arizona.. | ..157.. | ..31.. | ..449.. | ..83.. | ..490.. | ..96.. | ..+9.1%.. | ..+15.7%.. |
| ..Arkansas.. | ..38.. | ..5.. | ..253.. | ..43.. | ..302.. | ..36.. | ..+19.4%.. | ..-16.3%.. |
| ..California.. | ..1,134.. | ..310.. | ..2,787.. | ..732.. | ..3,215.. | ..777.. | ..+15.4%.. | ..+6.1%.. |
| ..Colorado.. | ..80.. | ..20.. | ..383.. | ..117.. | ..397.. | ..113.. | ..+3.7%.. | ..-3.4%.. |
| ..Connecticut.. | ..78.. | ..17.. | ..328.. | ..65.. | ..353.. | ..60.. | ..+7.6%.. | ..-7.7%.. |
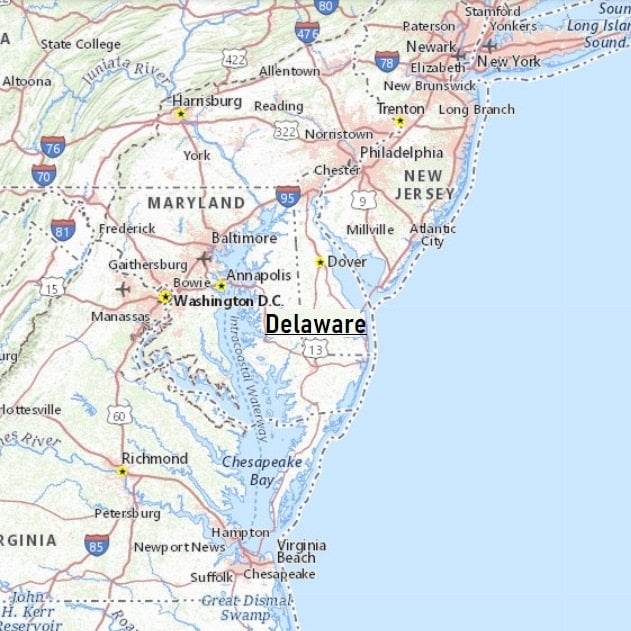
| ..Delaware.. | ..14.. | ..4.. | ..58.. | ..8.. | ..88.. | ..12.. | ..+51.7%.. | ..+50.0%.. |
| ..District.of.Columbia.. | ..16.. | ..5.. | ..43.. | ..9.. | ..72.. | ..21.. | ..+67.4%.. | ..+133.3%.. |
| ..Florida.. | ..922.. | ..189.. | ..1,096.. | ..160.. | ..1,332.. | ..225.. | ..+21.5%.. | ..+40.6%.. |
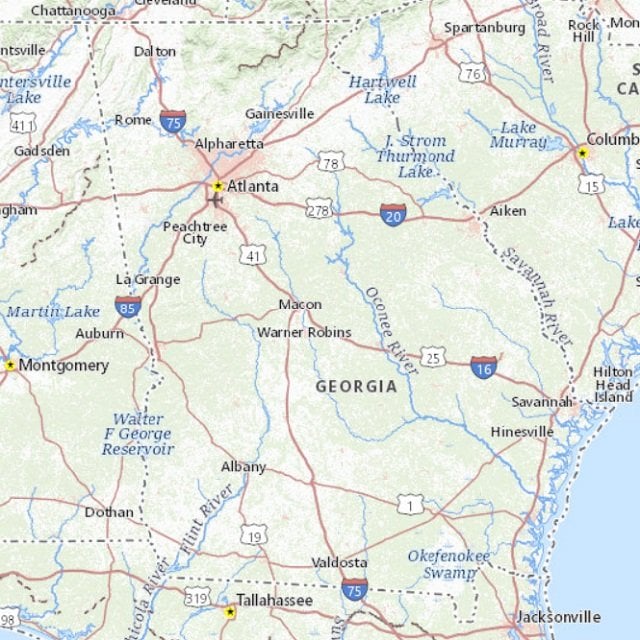
| ..Georgia.. | ..168.. | ..46.. | ..476.. | ..105.. | ..646.. | ..177.. | ..+35.7%.. | ..+68.6%.. |
| ..Hawaii.. | ..80.. | ..13.. | ..45.. | ..2.. | ..57.. | ..2.. | ..+26.7%.. | ..0%.. |
| ..Idaho.. | ..29.. | ..6.. | ..145.. | ..46.. | ..1+40.. | ..32.. | ..-3.4%.. | ..-30.4%.. |
| ..Illinois.. | ..179.. | ..35.. | ..1,245.. | ..273.. | ..1,353.. | ..290.. | ..+8.7%.. | ..+6.2%.. |
| ..Indiana.. | ..50.. | ..6.. | ..698.. | ..124.. | ..852.. | ..139.. | ..+22.1%.. | ..+12.1%.. |
| ..Iowa.. | ..24.. | ..3.. | ..377.. | ..64.. | ..350.. | ..45.. | ..-7.2%.. | ..-29.7%.. |
| ..Kansas.. | ..35.. | ..5.. | ..269.. | ..46.. | ..285.. | ..50.. | ..+5.9%.. | ..+8.7%.. |
| ..Kentucky.. | ..56.. | ..12.. | ..440.. | ..67.. | ..510.. | ..80.. | ..+15.9%.. | ..+19.4%.. |
| ..Louisiana.. | ..81.. | ..20.. | ..192.. | ..45.. | ..318.. | ..68.. | ..+65.6%.. | ..+51.1%.. |
| ..Maine.. | ..8.. | ..1.. | ..98.. | ..9.. | ..102.. | ..8.. | ..4.1%.. | ..-11.1%.. |
| ..Maryland.. | ..126.. | ..36.. | ..440.. | ..100.. | ..448.. | ..100.. | ..+1.8%.. | ..0%.. |
| ..Massachusetts.. | ..137.. | ..18.. | ..650.. | ..123.. | ..892.. | ..168.. | ..+37.2%.. | ..+36.6%.. |
| ..Michigan.. | ..147.. | ..13.. | ..940.. | ..183.. | ..1,094.. | ..218.. | ..+16.4%.. | ..+19.1%.. |
| ..Minnesota.. | ..34.. | ..9.. | ..469.. | ..107.. | ..509.. | ..98.. | ..+8.5%.. | ..-8.4%.. |
| ..Mississippi.. | ..34.. | ..8.. | ..130.. | ..17.. | ..166.. | ..24.. | ..+27.7%.. | ..+41.2%.. |
| ..Missouri.. | ..73.. | ..15.. | ..665.. | ..120.. | ..757.. | ..126.. | ..+13.8%.. | ..+5.0%.. |
| ..Montana.. | ..19.. | ..4.. | ..110.. | ..33.. | ..127.. | ..42.. | ..+15.5%.. | ..+27.3%.. |
| ..Nebraska.. | ..18.. | ..3.. | ..239.. | ..39.. | ..278.. | ..46.. | ..+16.3%.. | ..+17.9%.. |
| ..Nevada.. | ..77.. | ..16.. | ..171.. | ..53.. | ..195.. | ..42.. | ..+14.0%.. | ..-20.8%.. |
| ..New Hampshire.. | ..29.. | ..2.. | ..101.. | ..16.. | ..126.. | ..22.. | ..+24.8%.. | ..+37.5%.. |
| ..New Jersey.. | ..140.. | ..15.. | ..727.. | ..140.. | ..943.. | ..159.. | ..+29.7%.. | ..+13.6%.. |
| ..New Mexico.. | ..28.. | ..5.. | ..118.. | ..22.. | ..130.. | ..30.. | ..+10.2%.. | ..+36.4%.. |
| ..New York.. | ..459.. | ..141.. | ..1,789.. | ..417.. | ..2,371.. | ..496.. | ..+32.5%.. | ..+18.9%.. |
| ..North Carolina.. | ..142.. | ..30.. | ..532.. | ..103.. | ..687.. | ..139.. | ..+29.1%.. | ..+35.0%.. |
| ..North Dakota.. | ..8.. | ..-.. | ..70.. | ..19.. | ..75.. | ..18.. | ..+7.1%.. | ..-5.3%.. |
| ..Ohio.. | ..120.. | ..26.. | ..1,201.. | ..255.. | ..1,369.. | ..263.. | ..+14.0%.. | ..+3.1%.. |
| ..Oklahoma.. | ..39.. | ..4.. | ..395.. | ..79.. | ..409.. | ..81.. | ..+3.5%.. | ..+2.5%.. |
| ..Oregon.. | ..69.. | ..16.. | ..191.. | ..45.. | ..197.. | ..42.. | ..+3.1%.. | ..-6.7%.. |
| ..Pennsylvania.. | ..187.. | ..40.. | ..1,027.. | ..176.. | ..1,307.. | ..203.. | ..+27.3%.. | ..+15.3%.. |
| ..Puerto Rico.. | ..140.. | ..20.. | ..47.. | ..6.. | ..103.. | ..16.. | ..+119.1%.. | ..+166.7%.. |
| ..Rhode Island.. | ..15.. | ..3.. | ..78.. | ..8.. | ..97.. | ..16.. | ..+24.4%.. | ..+100.0%.. |
| ..South Carolina.. | ..80.. | ..15.. | ..256.. | ..50.. | ..375.. | ..69.. | ..+46.5%.. | ..+38.0%.. |
| ..South Dakota.. | ..10.. | ..3.. | ..109.. | ..24.. | ..124.. | ..21.. | ..+13.8%.. | ..-12.5%.. |
| ..Tennessee.. | ..73.. | ..12.. | ..470.. | ..92.. | ..502.. | ..74.. | ..+6.8%.. | ..-19.6%.. |
| ..Texas.. | ..480.. | ..160.. | ..1,393.. | ..361.. | ..1,784.. | ..372.. | ..+28.1%.. | ..+3.0%.. |
| ..Utah.. | ..42.. | ..16.. | ..216.. | ..68.. | ..184.. | ..68.. | ..-14.8%.. | ..0%.. |
| ..Vermont.. | ..9.. | ..-.. | ..41.. | ..8.. | ..57.. | ..11.. | ..+39.0%.. | ..+37.5%.. |
| ..Virginia.. | ..121.. | ..17.. | ..625.. | ..131.. | ..769.. | ..153.. | ..+23.0%.. | ..+16.8%.. |
| ..Washington.. | ..158.. | ..51.. | ..276.. | ..61.. | ..304.. | ..74.. | ..+10.1%.. | ..+21.3%.. |
| ..West Virginia.. | ..25.. | ..6.. | ..237.. | ..43.. | ..275.. | ..45.. | ..+16.0%.. | ..+4.7%.. |
| ..Wisconsin.. | ..60.. | ..18.. | ..520.. | ..130.. | ..645.. | ..163.. | ..+24.0%.. | ..+25.4%.. |
| ..Wyoming.. | ..11.. | ..8.. | ..29.. | ..13.. | ..37.. | ..6.. | ..+++27.6%.. | ..-53.8%.. |
| ..TOTAL.. | ..6,369.. | ..1,489.. | ..24,043.. | ..5,112.. | ..28,654.. | ..5,728.. | ..+19.2%.. | ..+12.1%.. |
Credit: Adobe Stock


 Slideshow