


 By
By  November 27, 2023 at 01:23 PM


The United States went into the Thanksgiving holiday week with a high mortality rate and a modest surge of people entering hospitals with COVID-19.
The United States recorded about 214,382 deaths from all causes in October, according to early death data published along with U.S. Centers for Disease Control and Prevention flu tracking report. The death count was 0.3% lower than in October 2022, but it was 10% higher than in October 2019, before the COVID-19 pandemic came to light.
Another set of data, a U.S. Department of Health and Human Services COVID-19 and flu hospitalization tracking spreadsheet, shows that hospital admissions for COVID-19 continue to be much higher than they were during the week ending July 1, when the pandemic seem to be fading away.
For people ages 20 through 59, the number of hospitalizations reported for the week ending Nov. 18 was 3,593. In the median state, the working-age hospitalization count was 9.7% higher than in the week ending Nov. 11, and it was 263% higher than in the week ending July 1.
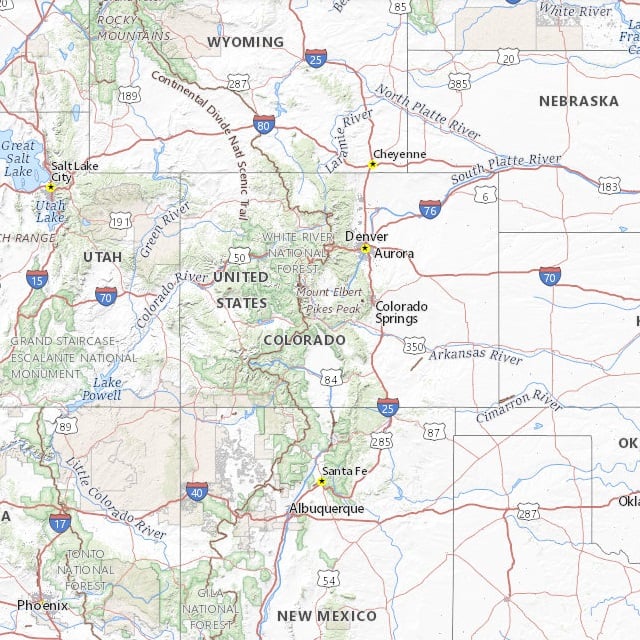
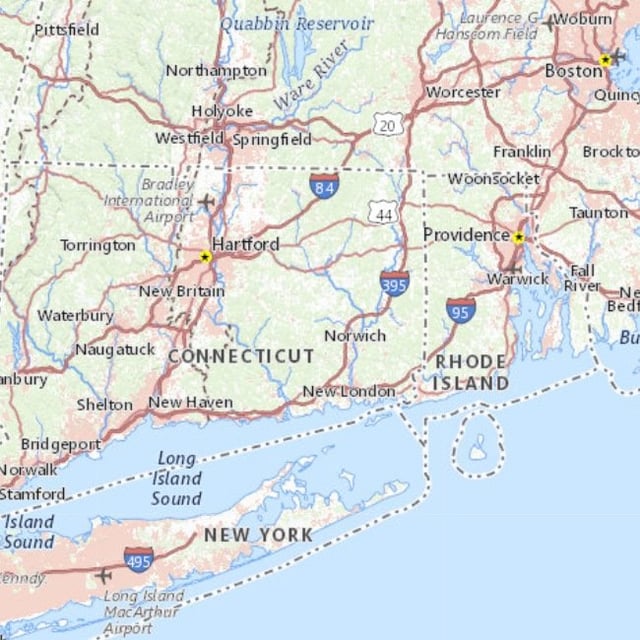
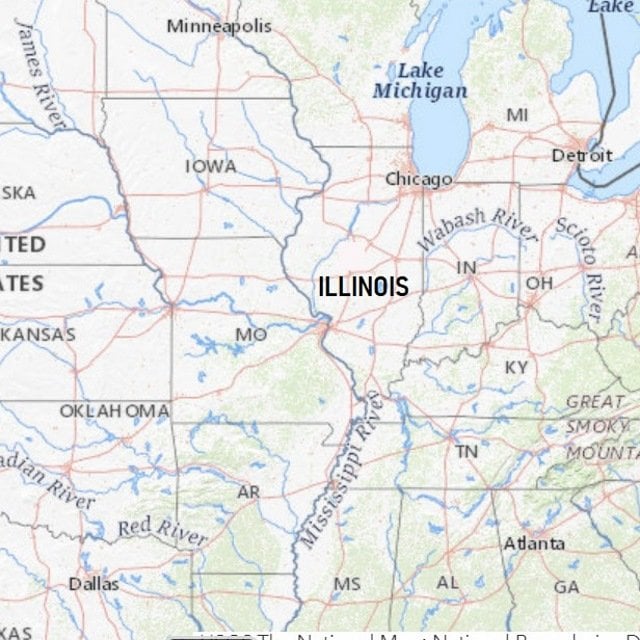
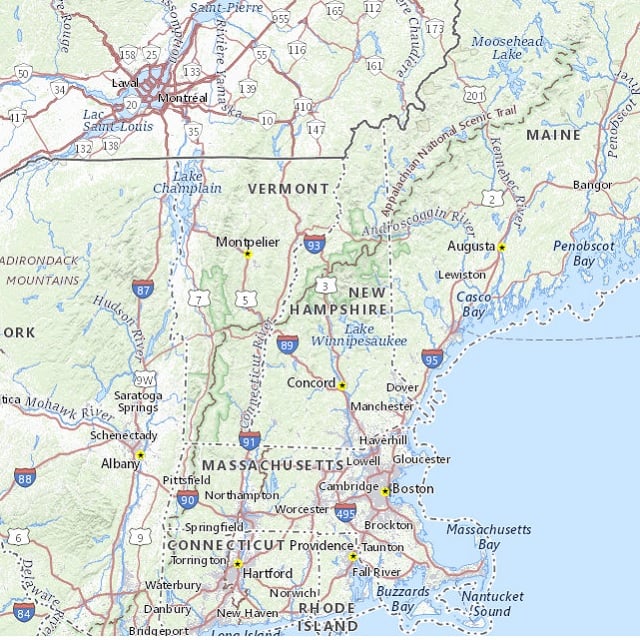
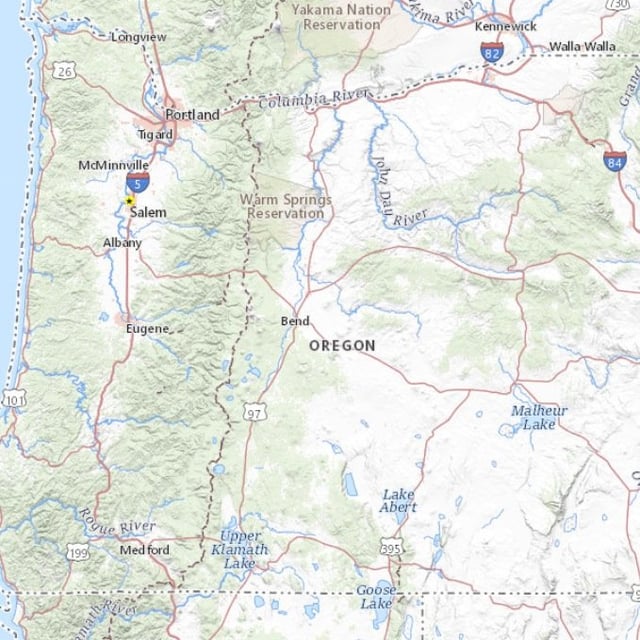
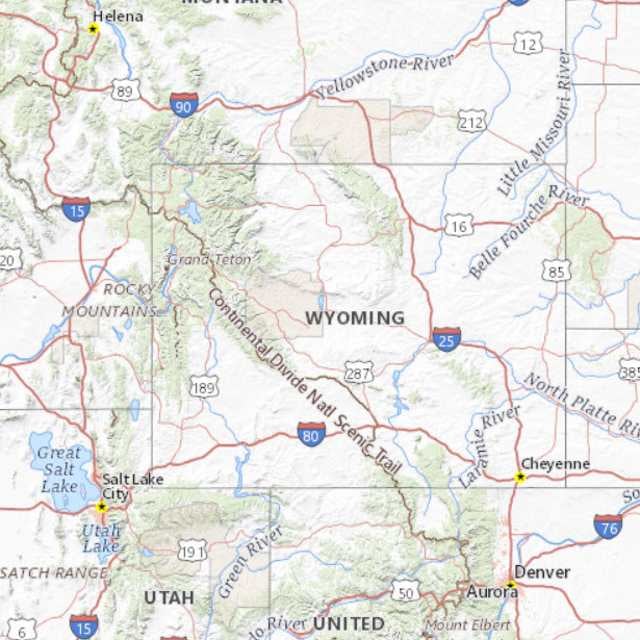
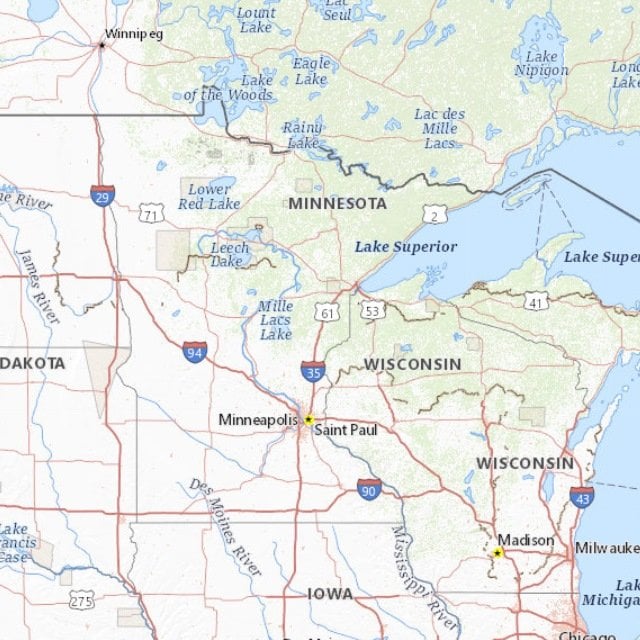
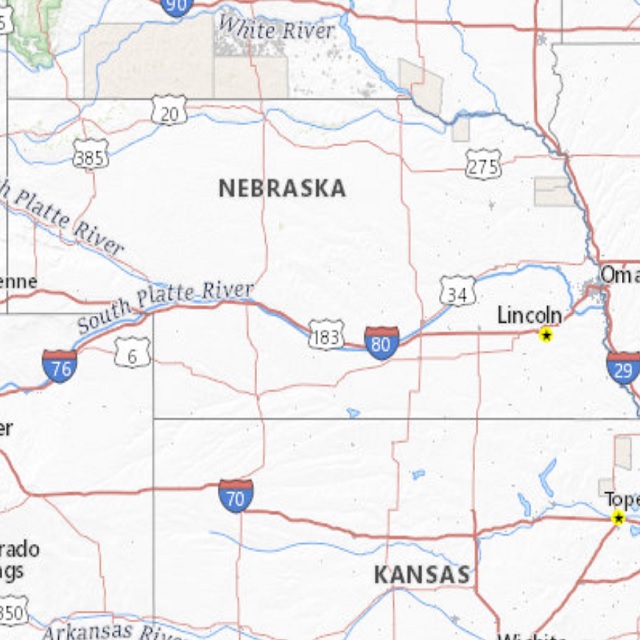
For a look at the 12 states where the working-age hospitalization count increased the most between the week ending Nov. 11 and the week Nov. 18, see the gallery above.
For figures for all 50 states, Puerto Rico and the District of Columbia, see the table below.
What it means: Clients and their financial professionals face the same old uncertainty about when, or if, mortality will get back to where it was in 2019.
The context: The current COVID-19 wave is much smaller than the surges that hit earlier in the pandemic.
Hospitals admitted about 147,000 adults with COVID-19 during the week ending Jan. 15, 2022, and about 16,000 U.S. residents died from COVID-19 during the week ending Jan. 16, 2021.
But the United States appears to be on track to record about 300,000 more deaths than it recorded in 2019, when 2.9 million people died.
The excess mortality is caused partly by COVID-19 itself; partly because of the effects of COVID-19 on health care, the health care system and society as a whole; and partly because of other causes, such as opioids.
| Hospital Admissions of Adults Ages 20-59 With Confirmed COVID-19 | |||||||
|---|---|---|---|---|---|---|---|
| State | For the week ending… | Change from | |||||
| .. | July 1 | Oct. 28 | Nov. 4 | Nov. 11 | Nov. 18 | July 1 | Nov. 11 |
| ..Alabama.. | ..29.. | ..59.. | ..50.. | ..49.. | ..48.. | ..+65.5%.. | ..-2.0%.. |
| ..Alaska.. | ..2.. | ..9.. | ..6.. | ..10.. | ..3.. | ..+50.0%.. | ..-70.0%.. |
| ..Arizona.. | ..31.. | ..89.. | ..65.. | ..96.. | ..120.. | ..+287.1%.. | ..+25.0%.. |
| ..Arkansas.. | ..5.. | ..26.. | ..22.. | ..24.. | ..23.. | ..+360.0%.. | ..-4.2%.. |
| ..California.. | ..310.. | ..407.. | ..416.. | ..430.. | ..449.. | ..+44.8%.. | ..+4.4%.. |
| ..Colorado.. | ..20.. | ..116.. | ..115.. | ..113.. | ..152.. | ..+660.0%.. | ..+34.5%.. |
| ..Connecticut.. | ..17.. | ..34.. | ..28.. | ..35.. | ..48.. | ..+182.4%.. | ..+37.1%.. |
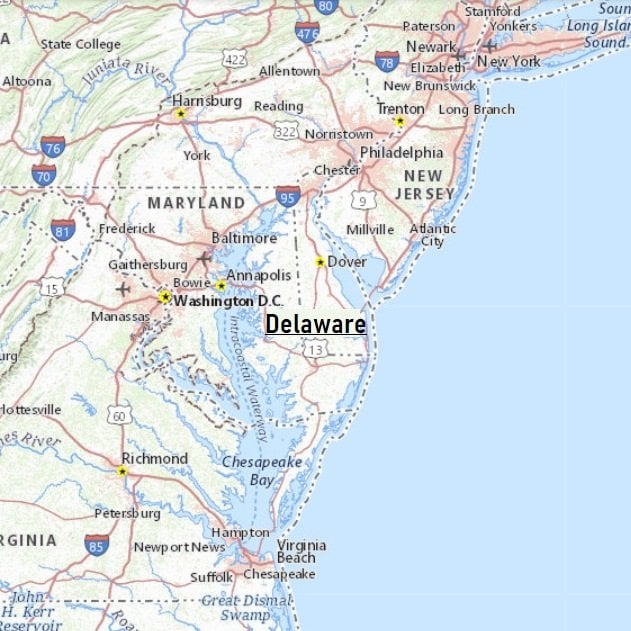
| ..Delaware.. | ..4.. | ..10.. | ..7.. | ..6.. | ..8.. | ..+100.0%.. | ..+33.3%.. |
| ..District.of.Columbia.. | ..5.. | ..13.. | ..11.. | ..11.. | ..8.. | ..+60.0%.. | ..-27.3%.. |
| ..Florida.. | ..189.. | ..122.. | ..120.. | ..108.. | ..100.. | ..-47.1%.. | ..-7.4%.. |
| ..Georgia.. | ..46.. | ..81.. | ..72.. | ..86.. | ..100.. | ..+117.4%.. | ..+16.3%.. |
| ..Hawaii.. | ..13.. | ..9.. | ..14.. | ..14.. | ..9.. | ..-30.8%.. | ..-35.7%.. |
| ..Idaho.. | ..6.. | ..14.. | ..16.. | ..24.. | ..24.. | ..+300.0%.. | ..+0.0%.. |
| ..Illinois.. | ..35.. | ..153.. | ..135.. | ..144.. | ..204.. | ..+482.9%.. | ..+41.7%.. |
| ..Indiana.. | ..6.. | ..64.. | ..33.. | ..66.. | ..75.. | ..+1,150.0%.. | ..+13.6%.. |
| ..Iowa.. | ..3.. | ..25.. | ..18.. | ..19.. | ..22.. | ..+633.3%.. | ..+15.8%.. |
| ..Kansas.. | ..5.. | ..36.. | ..41.. | ..57.. | ..35.. | ..+600.0%.. | ..-38.6%.. |
| ..Kentucky.. | ..12.. | ..41.. | ..60.. | ..76.. | ..67.. | ..+458.3%.. | ..-11.8%.. |
| ..Louisiana.. | ..20.. | ..23.. | ..21.. | ..17.. | ..21.. | ..+5.0%.. | ..+23.5%.. |
| ..Maine.. | ..1.. | ..6.. | ..5.. | ..12.. | ..6.. | ..+500.0%.. | ..-50.0%.. |
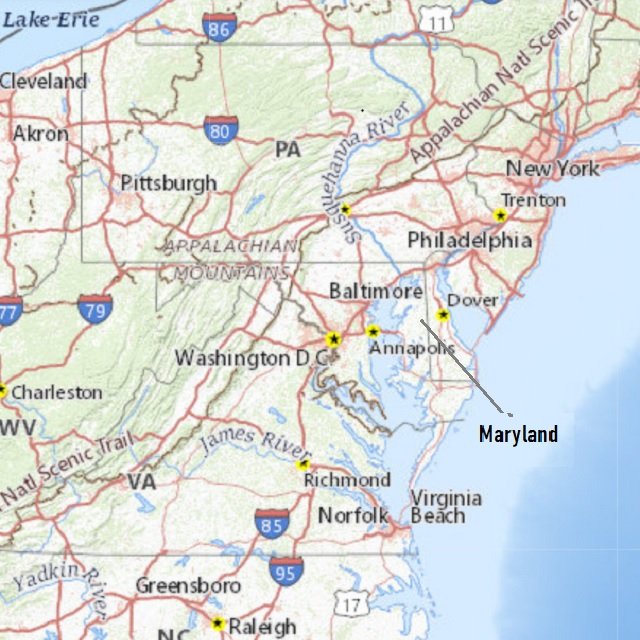
| ..Maryland.. | ..36.. | ..48.. | ..45.. | ..56.. | ..73.. | ..+102.8%.. | ..+30.4%.. |
| ..Massachusetts.. | ..18.. | ..67.. | ..69.. | ..72.. | ..61.. | ..+238.9%.. | ..-15.3%.. |
| ..Michigan.. | ..14.. | ..104.. | ..93.. | ..119.. | ..115.. | ..+721.4%.. | ..-3.4%.. |
| ..Minnesota.. | ..9.. | ..39.. | ..40.. | ..47.. | ..86.. | ..+855.6%.. | ..+83.0%.. |
| ..Mississippi.. | ..8.. | ..17.. | ..18.. | ..12.. | ..13.. | ..+62.5%.. | ..+8.3%.. |
| ..Missouri.. | ..15.. | ..59.. | ..60.. | ..77.. | ..78.. | ..+420.0%.. | ..+1.3%.. |
| ..Montana.. | ..4.. | ..10.. | ..15.. | ..25.. | ..23.. | ..+475.0%.. | ..-8.0%.. |
| ..Nebraska.. | ..3.. | ..11.. | ..15.. | ..18.. | ..33.. | ..+1,000.0%.. | ..+83.3%.. |
| ..Nevada.. | ..16.. | ..46.. | ..30.. | ..28.. | ..30.. | ..+87.5%.. | ..+7.1%.. |
| ..New Hampshire.. | ..2.. | ..18.. | ..12.. | ..4.. | ..10.. | ..+400.0%.. | ..+150.0%.. |
| ..New Jersey.. | ..15.. | ..82.. | ..65.. | ..72.. | ..69.. | ..+360.0%.. | ..-4.2%.. |
| ..New Mexico.. | ..5.. | ..33.. | ..39.. | ..41.. | ..44.. | ..+780.0%.. | ..+7.3%.. |
| ..New York.. | ..141.. | ..258.. | ..213.. | ..197.. | ..233.. | ..+65.2%.. | ..+18.3%.. |
| ..North Carolina.. | ..30.. | ..78.. | ..71.. | ..65.. | ..74.. | ..+146.7%.. | ..+13.8%.. |
| ..North Dakota.. | ..0.. | ..12.. | ..5.. | ..8.. | ..6.. | ..-.. | ..-25.0%.. |
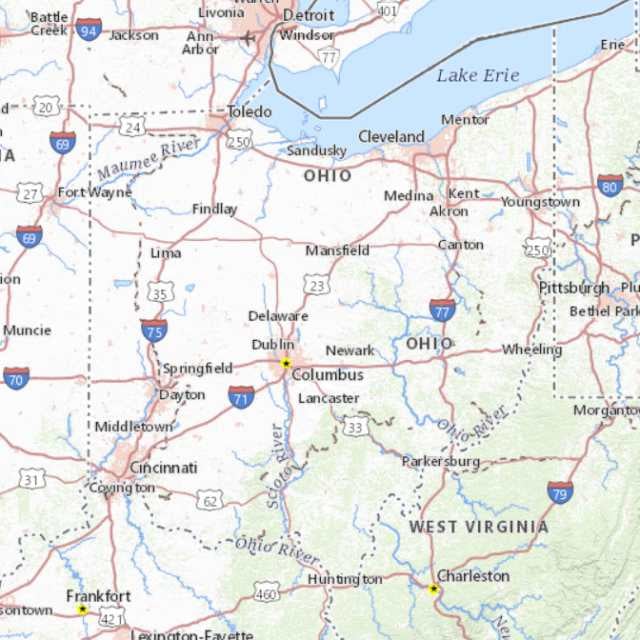
| ..Ohio.. | ..26.. | ..126.. | ..128.. | ..114.. | ..149.. | ..+473.1%.. | ..+30.7%.. |
| ..Oklahoma.. | ..4.. | ..29.. | ..34.. | ..32.. | ..41.. | ..+925.0%.. | ..+28.1%.. |
| ..Oregon.. | ..16.. | ..42.. | ..30.. | ..26.. | ..44.. | ..+175.0%.. | ..+69.2%.. |
| ..Pennsylvania.. | ..40.. | ..126.. | ..101.. | ..136.. | ..126.. | ..+215.0%.. | ..-7.4%.. |
| ..Puerto Rico.. | ..20.. | ..13.. | ..5.. | ..10.. | ..17.. | ..-15.0%.. | ..+70.0%.. |
| ..Rhode Island.. | ..3.. | ..11.. | ..10.. | ..7.. | ..3.. | ..+0.0%.. | ..-57.1%.. |
| ..South Carolina.. | ..15.. | ..51.. | ..44.. | ..42.. | ..40.. | ..+166.7%.. | ..-4.8%.. |
| ..South Dakota.. | ..3.. | ..19.. | ..14.. | ..17.. | ..21.. | ..+600.0%.. | ..+23.5%.. |
| ..Tennessee.. | ..12.. | ..43.. | ..34.. | ..43.. | ..48.. | ..+300.0%.. | ..+11.6%.. |
| ..Texas.. | ..160.. | ..295.. | ..274.. | ..357.. | ..301.. | ..+88.1%.. | ..-15.7%.. |
| ..Utah.. | ..16.. | ..42.. | ..38.. | ..38.. | ..37.. | ..+131.3%.. | ..-2.6%.. |
| ..Vermont.. | ..0.. | ..9.. | ..1.. | ..5.. | ..8.. | ..-.. | ..+60.0%.. |
| ..Virginia.. | ..17.. | ..93.. | ..68.. | ..73.. | ..86.. | ..+405.9%.. | ..+17.8%.. |
| ..Washington.. | ..51.. | ..56.. | ..52.. | ..58.. | ..63.. | ..+23.5%.. | ..+8.6%.. |
| ..West Virginia.. | ..6.. | ..26.. | ..16.. | ..28.. | ..31.. | ..+416.7%.. | ..+10.7%.. |
| ..Wisconsin.. | ..18.. | ..87.. | ..71.. | ..89.. | ..101.. | ..+461.1%.. | ..+13.5%.. |
| ..Wyoming.. | ..8.. | ..5.. | ..4.. | ..4.. | ..7.. | ..-12.5%.. | ..+75.0%.. |
| ..TOTAL.. | ..1,490.. | ..3,292.. | ..2,969.. | ..3,317.. | ..3,593.. | .... | .... |
| ..MEDIAN.. | .... | .... | .... | .... | .... | ..263.0%.. | ..9.7%.. |
Credit: Adobe Stock


 Slideshow