


 By
By  January 09, 2024 at 10:35 AM


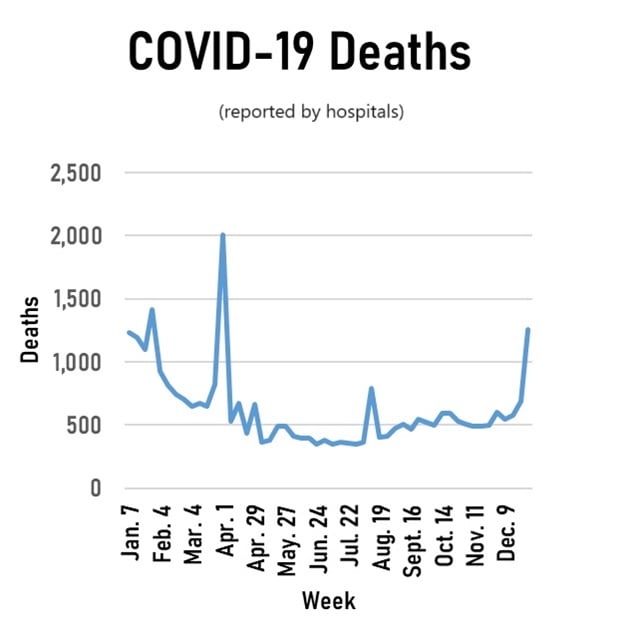
The fall COVID-19 surge appears to be causing a noticeable increase in the number of U.S. deaths as well as an increase in hospital admissions.
The hospitals still participating in a U.S. Department of Health and Human Services COVID data reporting program recorded 1,260 deaths of patients with COVID during the week ending Dec. 30, 2023, up 84% from the total recorded the previous week.
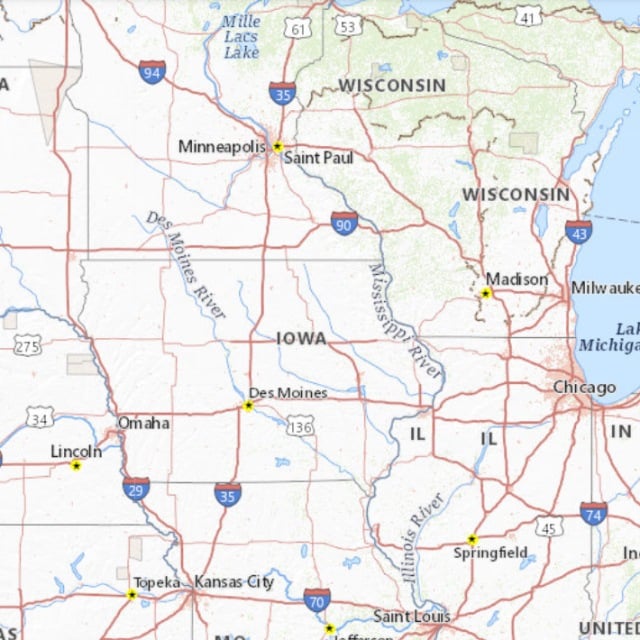
Iowa threw off the counts by submitting what appears to be a large batch of old data along with new data Dec. 26 and Dec. 27. Excluding the Iowa results, the national COVID death count increased 15%, to 779.
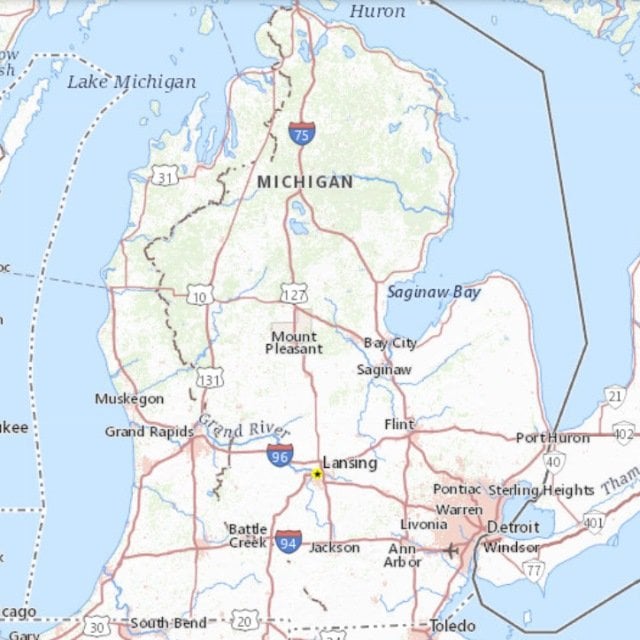
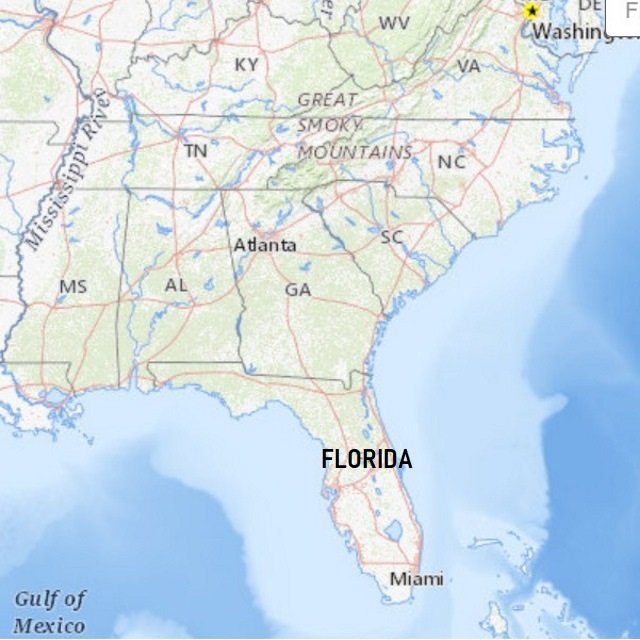
For a look at the seven states with the highest COVID-related death counts for the week ending Dec. 30, including Iowa, see the gallery above.
For recent numbers for all 50 states and some other jurisdictions, see the table below.
What it means: Mortality is still not going back to what it was in 2019, before the COVID pandemic came to light.
Any financial projections that rely on the old life expectancy estimates may be off the mark.
The numbers: HHS depends on hospitals to send in death counts and other data voluntarily.
The number of hospital reports sent to the CDC over the course of a week peaked at about 41,400 in late 2021.
The number of reports filed fell to 38% of the pandemic maximum for the first week of 2023 and was down to 24% of the pandemic maximum for the last week of the year.
Some hospitals may have stopped reporting, or stopped reporting as often, because they see few COVID-19 patients, but the CDC tables do not provide estimates of how the drop in reporting has affected the results.
Even with the Iowa deaths excluded, the national count for the week ending Dec. 30 was the fourth worst HHS has reported since the week ending Feb. 11.
The latest total was more than twice the total reported for the week ending July 1, when the pandemic seemed to be flickering out.
The flu figures: The U.S. Centers for Disease Control and Prevention uses a separate set of preliminary death counts, for deaths of U.S. residents of all ages from all causes, to determine whether the country has entered an influenza epidemic.
The numbers in the CDC’s FluView newsletter charts take about four weeks to firm up.
The chart for the week ending Dec. 30, 2023, shows that the CDC had included about 3 million deaths of people of all ages from all causes in the 2023 death data.
That was 8.6% higher than the death total for 2019 that the CDC had included in the FluView chart showing the first data for the last week of 2019.
The FluView death counts include deaths from heart disease, cancer, accidents, homicide, and all other incidents and conditions, including the economic effects of the pandemic and any harm done by efforts to prevent and treat COVID.
Here’s how the early quarterly FluView death figures for 2023 compare with the comparable quarterly FluView death figures for 2019:
- Q1: 814,568 (8.2% higher)
- Q2: 742,772 (6.6% higher)
- Q3: 843,025 (9.1% higher)
- Q4: 687,858 (8.6% higher)
Adult Deaths from COVID-19 |
|||||
|---|---|---|---|---|---|
| In the week ending… | Change between the weeks ending Dec. 23 and Dec. 30 | ||||
| July 1 | Dec. 16 | Dec. 23 | Dec. 30 | ||
| …Alabama… | …0… | …6… | …4… | …7… | …+3… |
| …Alaska… | …3… | …1… | …1… | …2… | …+1… |
| …Arizona… | …0… | …1… | …83… | …6… | …-77… |
| …Arkansas… | …0… | …3… | …1… | …9… | …+8… |
| …California… | …67… | …91… | …91… | …85… | …-6… |
| …Colorado… | …0… | …4… | …4… | …2… | …-2… |
| …Connecticut… | …2… | …0… | …0… | …1… | …+1… |
| …Delaware… | …0… | …0… | …0… | …0… | …0… |
| …District.of.Columbia… | …0… | …0… | …0… | …0… | …0… |
| …Florida… | …74… | …75… | …90… | …199… | …+109… |
| …Georgia… | …3… | …3… | …4… | …7… | …+3… |
| …Hawaii… | …0… | …0… | …1… | …1… | …0… |
| …Idaho… | …2… | …3… | …10… | …3… | …-7… |
| …Illinois… | …8… | …22… | …12… | …19… | …+7… |
| …Indiana… | …0… | …20… | …20… | …16… | …-4… |
| …Iowa… | …2… | …4… | …9… | …481… | …+472… |
| …Kansas… | …1… | …1… | …3… | …1… | …-2… |
| …Kentucky… | …0… | …1… | …2… | …2… | …0… |
| …Louisiana… | …0… | …2… | …5… | …6… | …+1… |
| …Maine… | …0… | …0… | …1… | …0… | …-1… |
| …Maryland… | …2… | …13… | …10… | …15… | …+5… |
| …Massachusetts… | …0… | …0… | …0… | …0… | …0… |
| …Michigan… | …10… | …51… | …34… | …53… | …+19… |
| …Minnesota… | …0… | …0… | …0… | …0… | …0… |
| …Mississippi… | …1… | …0… | …0… | …0… | …0… |
| …Missouri… | …3… | …24… | …25… | …19… | …-6… |
| …Montana… | …1… | …5… | …4… | …8… | …+4… |
| …Nebraska… | …0… | …0… | …1… | …0… | …-1… |
| …Nevada… | …2… | …2… | …4… | …2… | …-2… |
| …New Hampshire… | …0… | …0… | …0… | …0… | …0… |
| …New Jersey… | …0… | …0… | …0… | …0… | …0… |
| …New Mexico… | …0… | …0… | …0… | …0… | …0… |
| …New York… | …37… | …54… | …70… | …71… | …+1… |
| …North Carolina… | …68… | …87… | …75… | …101… | …+26… |
| …North Dakota… | …27… | …0… | …0… | …0… | …0… |
| …Ohio… | …2… | …4… | …1… | …6… | …+5… |
| …Oklahoma… | …3… | …9… | …7… | …11… | …+4… |
| …Oregon… | …6… | …24… | …25… | …20… | …-5… |
| …Pennsylvania… | …0… | …3… | …2… | …4… | …+2… |
| …Puerto Rico… | …0… | …1… | …0… | …0… | …0… |
| …Rhode Island… | …0… | …0… | …0… | …0… | …0… |
| …South Carolina… | …1… | …8… | …13… | …11… | …-2… |
| …South Dakota… | …0… | …0… | …0… | …0… | …0… |
| …Tennessee… | …1… | …10… | …14… | …18… | …+4… |
| …Texas… | …7… | …13… | …18… | …22… | …+4… |
| …Utah… | …0… | …1… | …1… | …1… | …0… |
| …Vermont… | …0… | …1… | …1… | …3… | …+2… |
| …Virginia… | …45… | …28… | …37… | …41… | …+4… |
| …Washington… | …5… | …0… | …0… | …0… | …0… |
| …West Virginia… | …0… | …0… | …0… | …0… | …0… |
| …Wisconsin… | …0… | …4… | …2… | …6… | …+4… |
| …Wyoming… | …0… | …0… | …0… | …1… | …+1… |
| …TOTAL (excluding Iowa)… | …381… | …575… | …676… | …779… | …+103… |
Credit: Adobe Stock


 Slideshow